Tesla, Inc. Report
Focus: Tesla electric-vehicle sales performance: comparing worldwide
deliveries, U.S. model-level sales estimates, and European
registrations.
Why Tesla's Quarterly Performance Matters
This page will help car shoppers, investors, students, and EV
enthusiasts research Tesla's sales performance and draw informed
conclusions from multiple kinds of automotive data. It explains how to
distinguish Tesla's official worldwide delivery totals from third-party
U.S. sales estimates and European vehicle-registration counts. By
combining the sources, a reader can judge whether a change is global or
regional, whether it is driven by the Model 3 and Model Y or by Tesla's
other models, and how Tesla compares with the wider EV market.
Tesla M3/MY Quarterly Performance
Tesla Q2 2026 Update

+25.2% Deliveries YoY
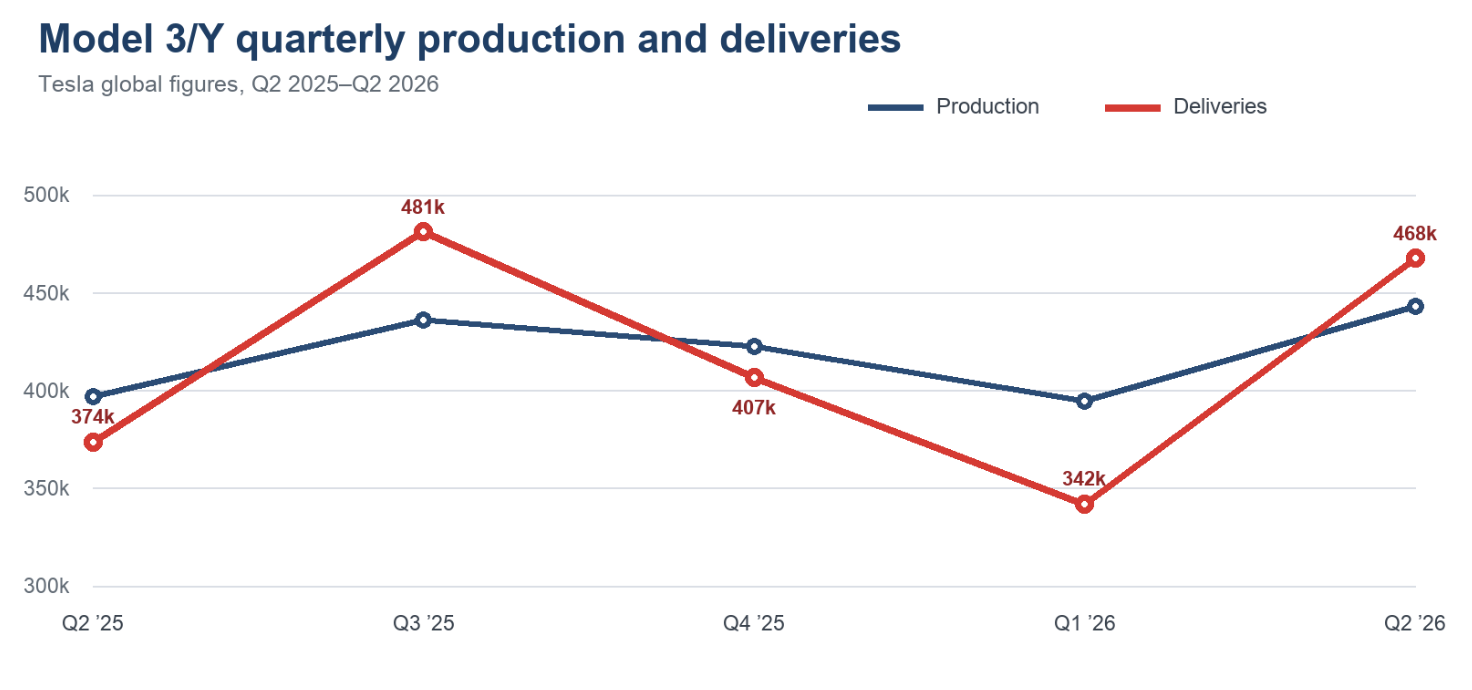
Figure 1. Line Chart Generated from data found in
this
report by ChatGPT Work
Tesla’s combined Model 3/Y deliveries rose from 373,728 in Q2 2025 to
467,762 in Q2 2026.
Tesla "Other" Models Quarterly Performance
Model S, Model X, and Cybertruck
+19.0% Deliveries YoY
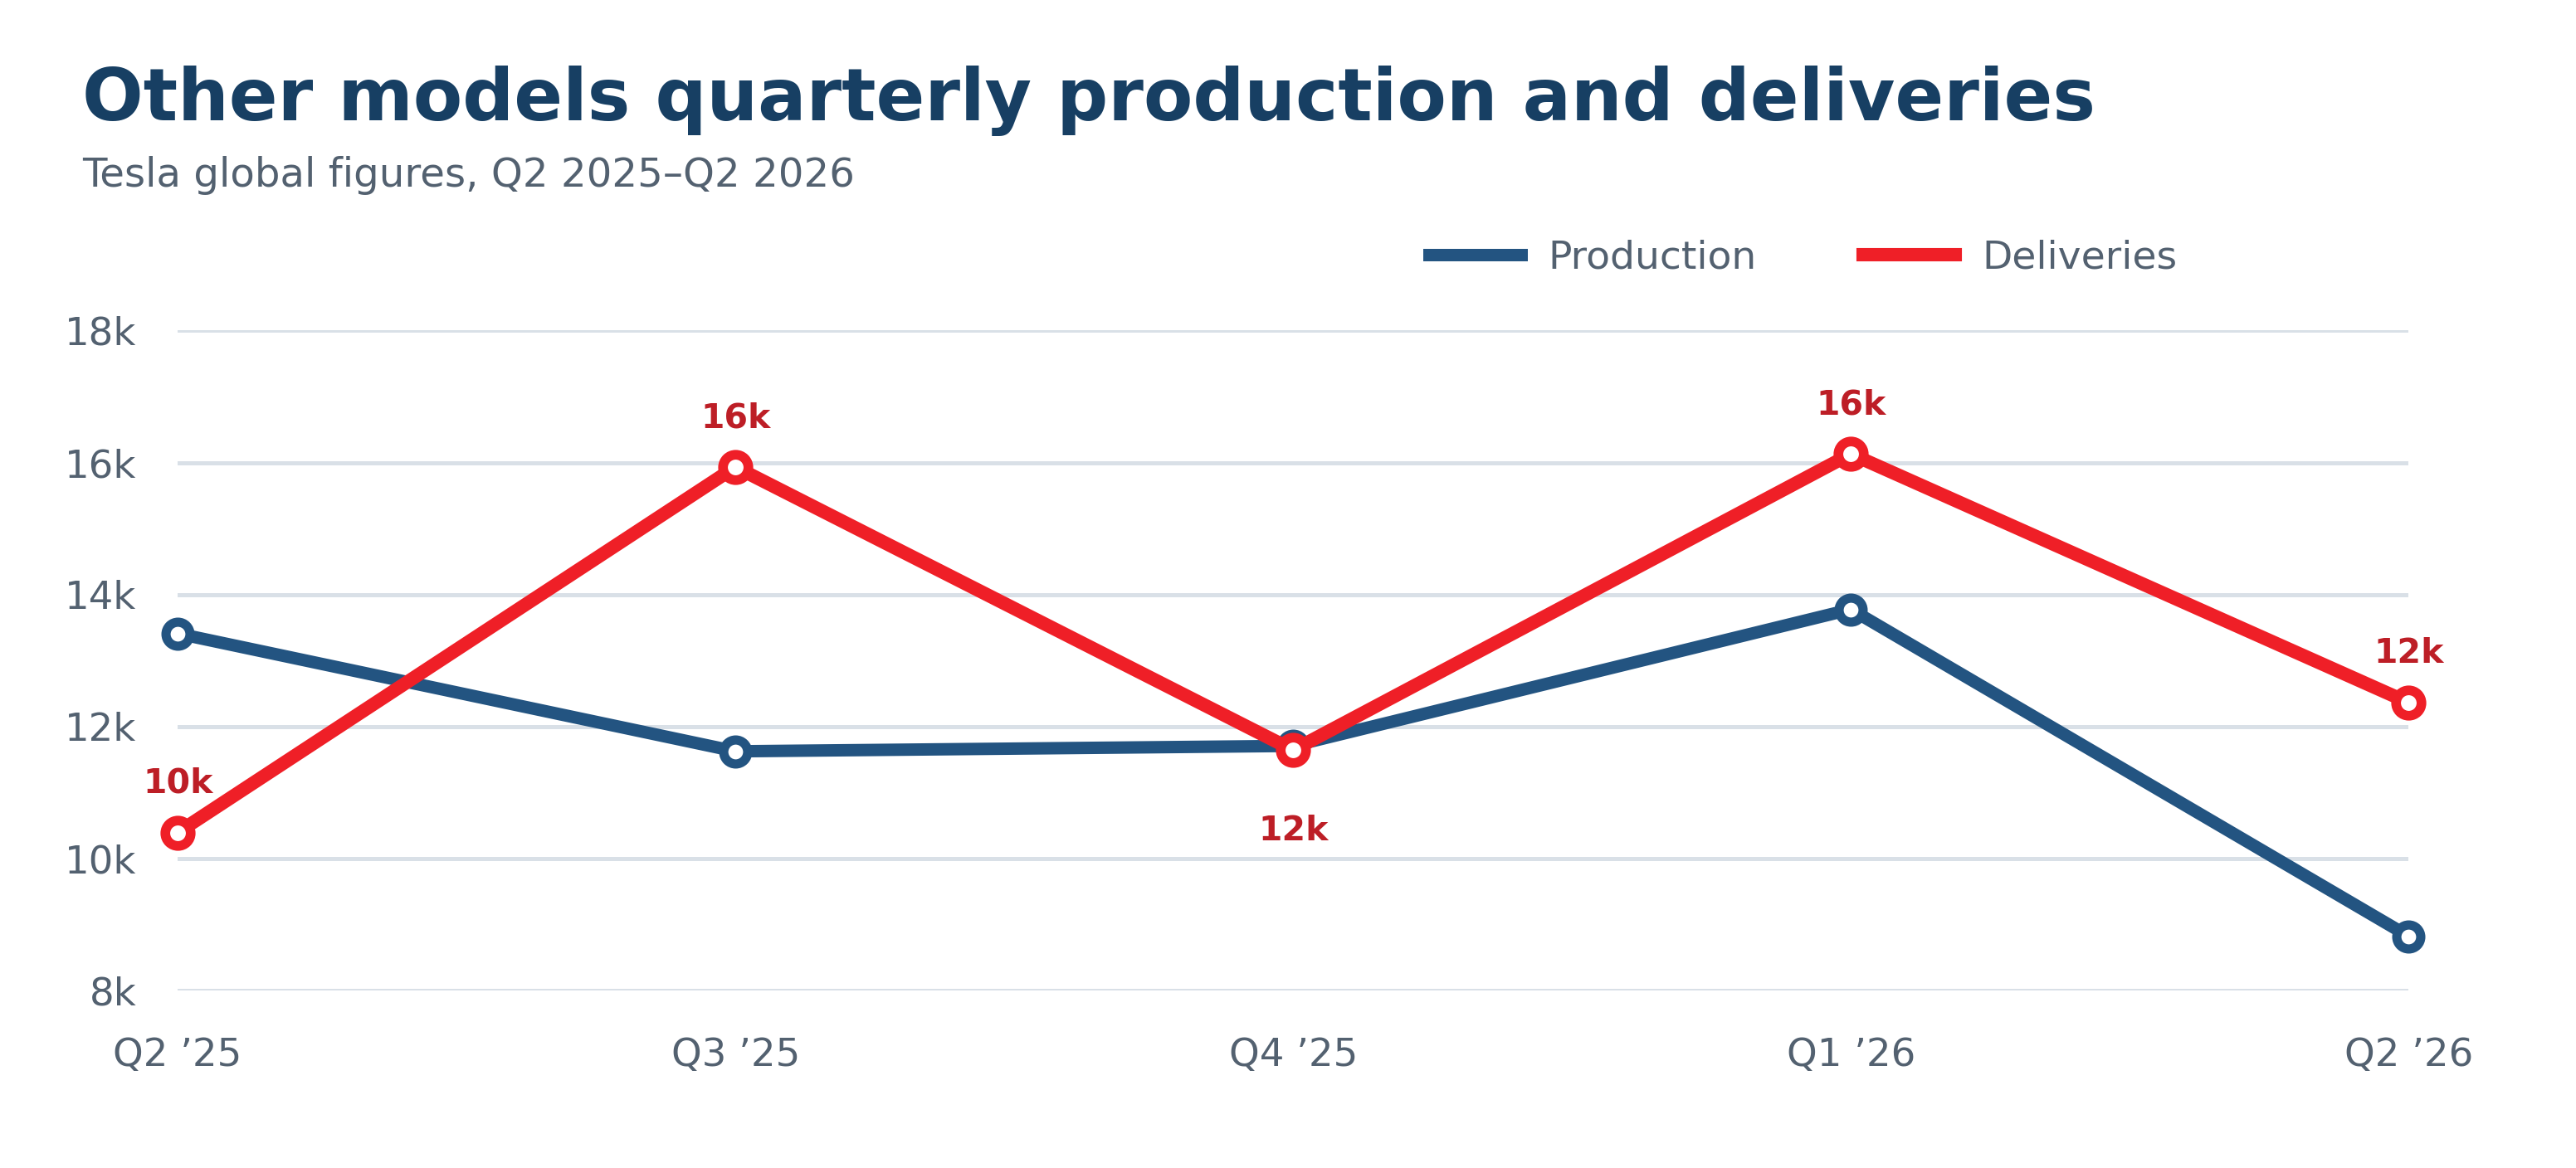
Figure 2. Line Chart Generated from data found in
this
report by ChatGPT Work
Tesla’s other models accounted for less than 3% of Q2 2026 deliveries.
Other Models improved 19.0% year over year but fell 23.3% from Q1 2026,
showing that Tesla's worldwide deliveries remain concentrated in Model 3
and Model Y.
Tesla Quarterly Delivery Summary
+25.0% Deliveries YoY
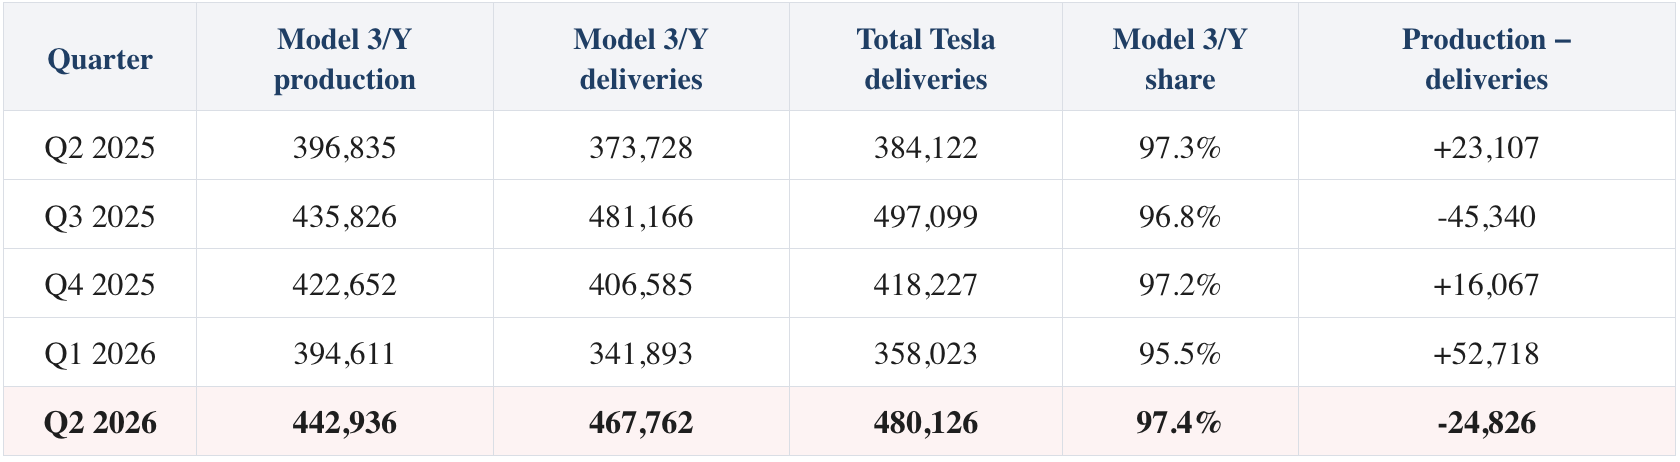
Figure 3. Table Generated from data found in
this
report by ChatGPT Work
Tesla’s total worldwide deliveries rose from 384,122 in Q2 2025 to
480,126 in Q2 2026. Inventory improved from 27 days in Q1 to 15 days in
Q2 as deliveries outpaced production during the quarter.
Tesla U.S. EV Sales Estimates
Kelley Blue Book

-13.1% Estimated U.S. Sales YoY
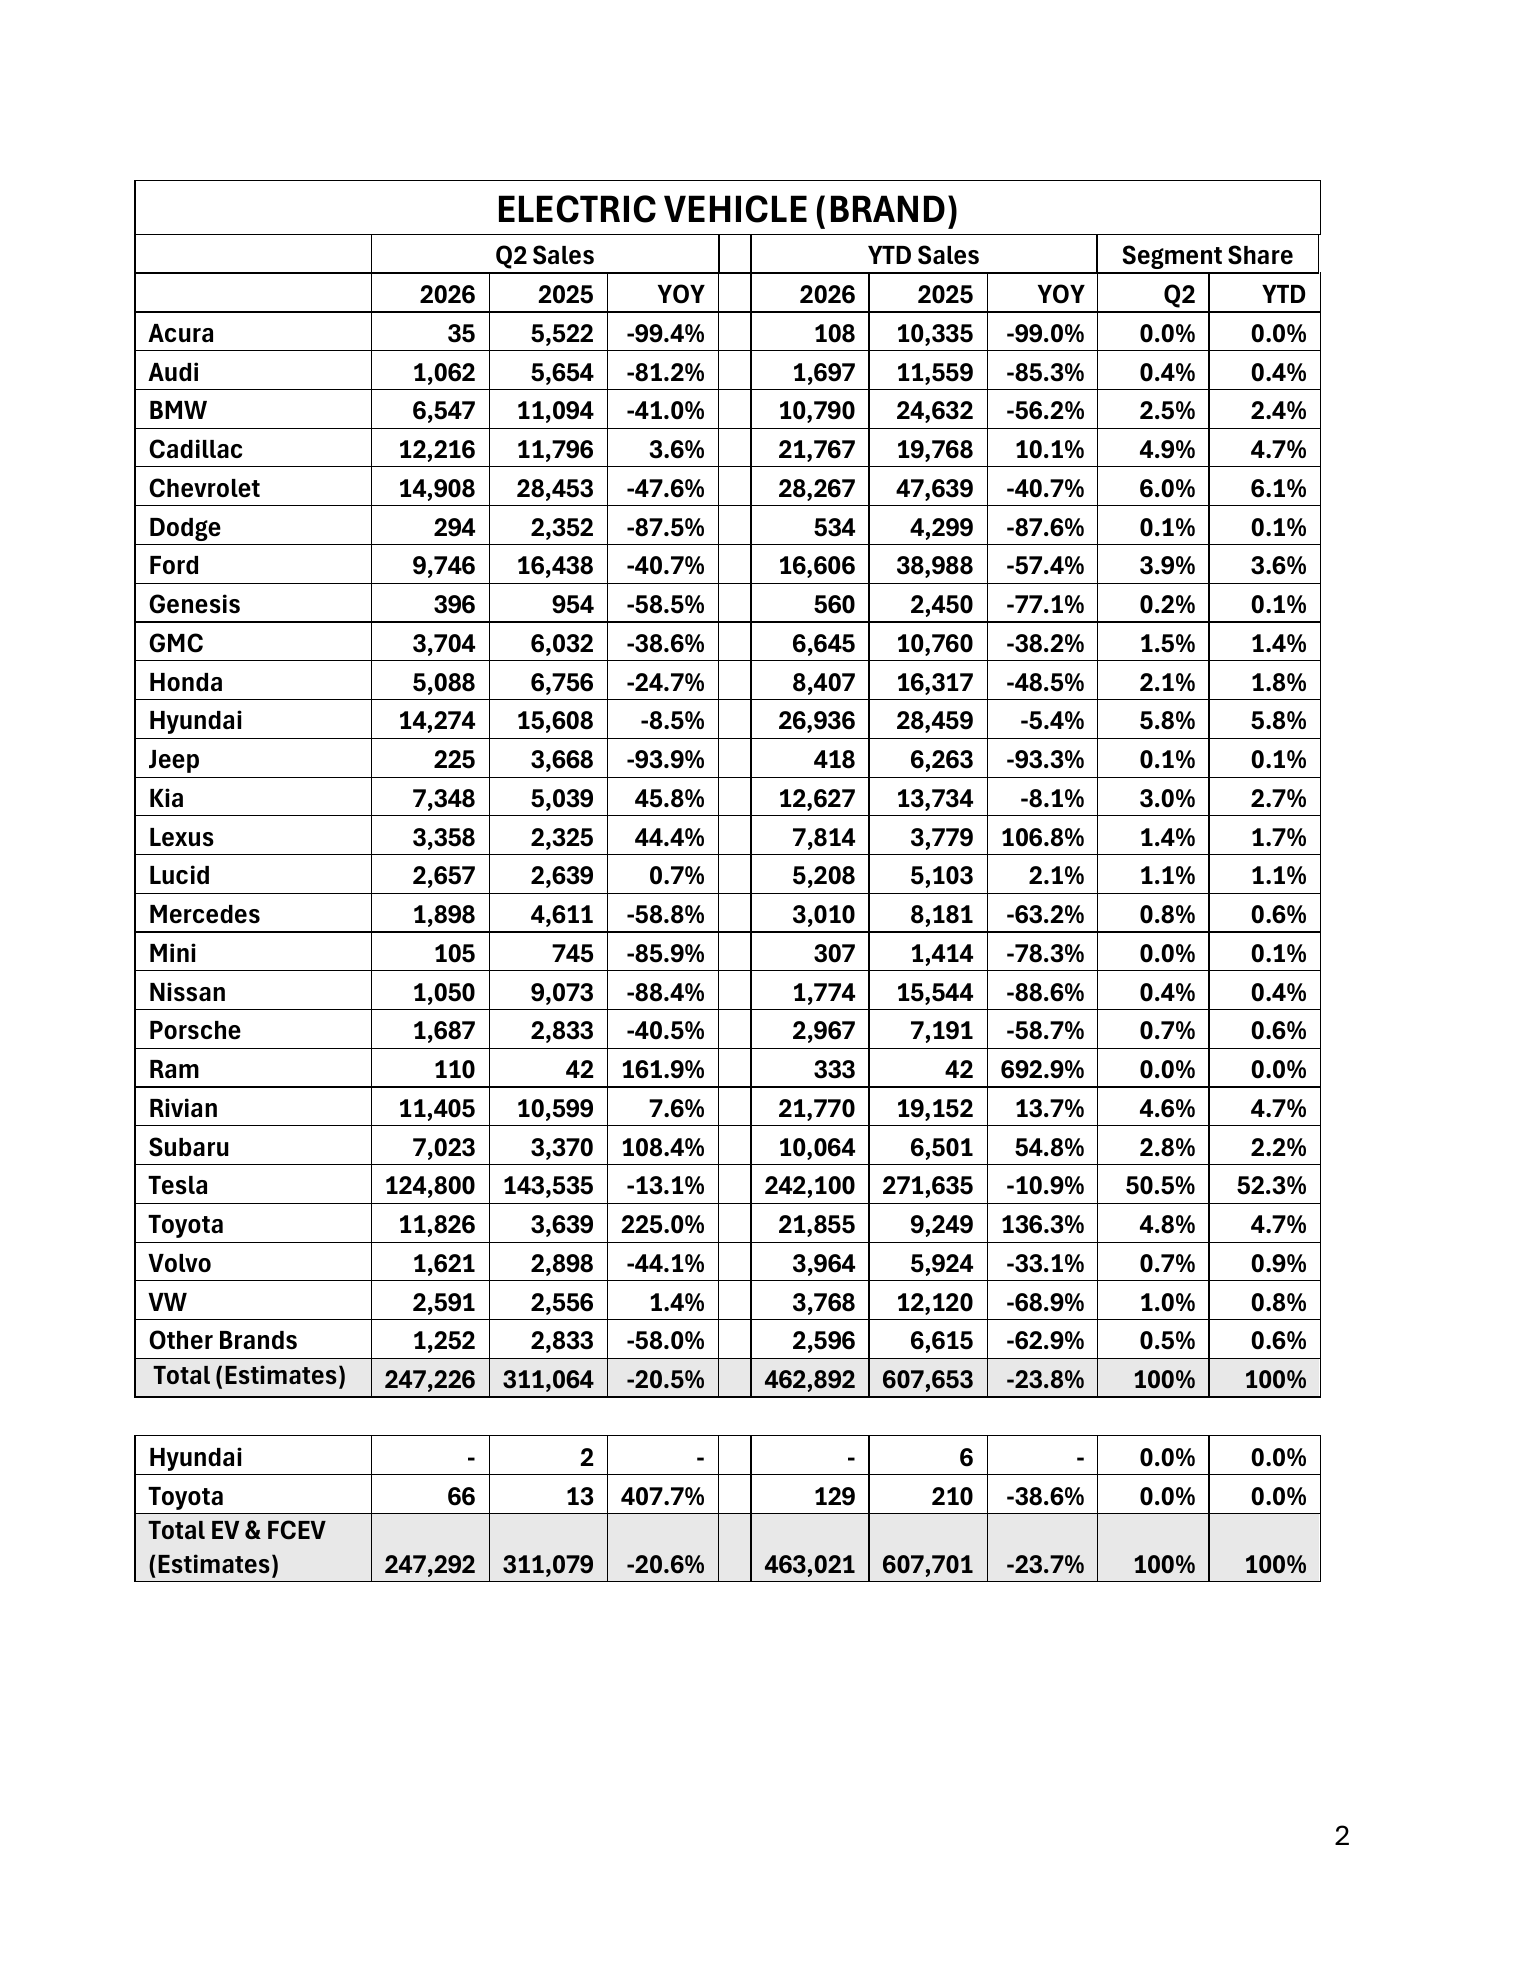
Figure 4. U.S. EV Brand Sales Table from
this
report by Kelley Blue Book and Cox Automotive
Tesla accounted for an estimated 124,800 U.S. EV sales and 50.5% of
the U.S. EV segment in Q2 2026. Even with more than half of the
segment, Tesla's estimated U.S. sales fell 13.1% from Q2 2025. The
entire U.S. EV market totaled an estimated 247,226 vehicles, up 14.7%
from Q1 but down 20.5% year over year, and EVs were about 5.8% of all
U.S. new-vehicle sales.
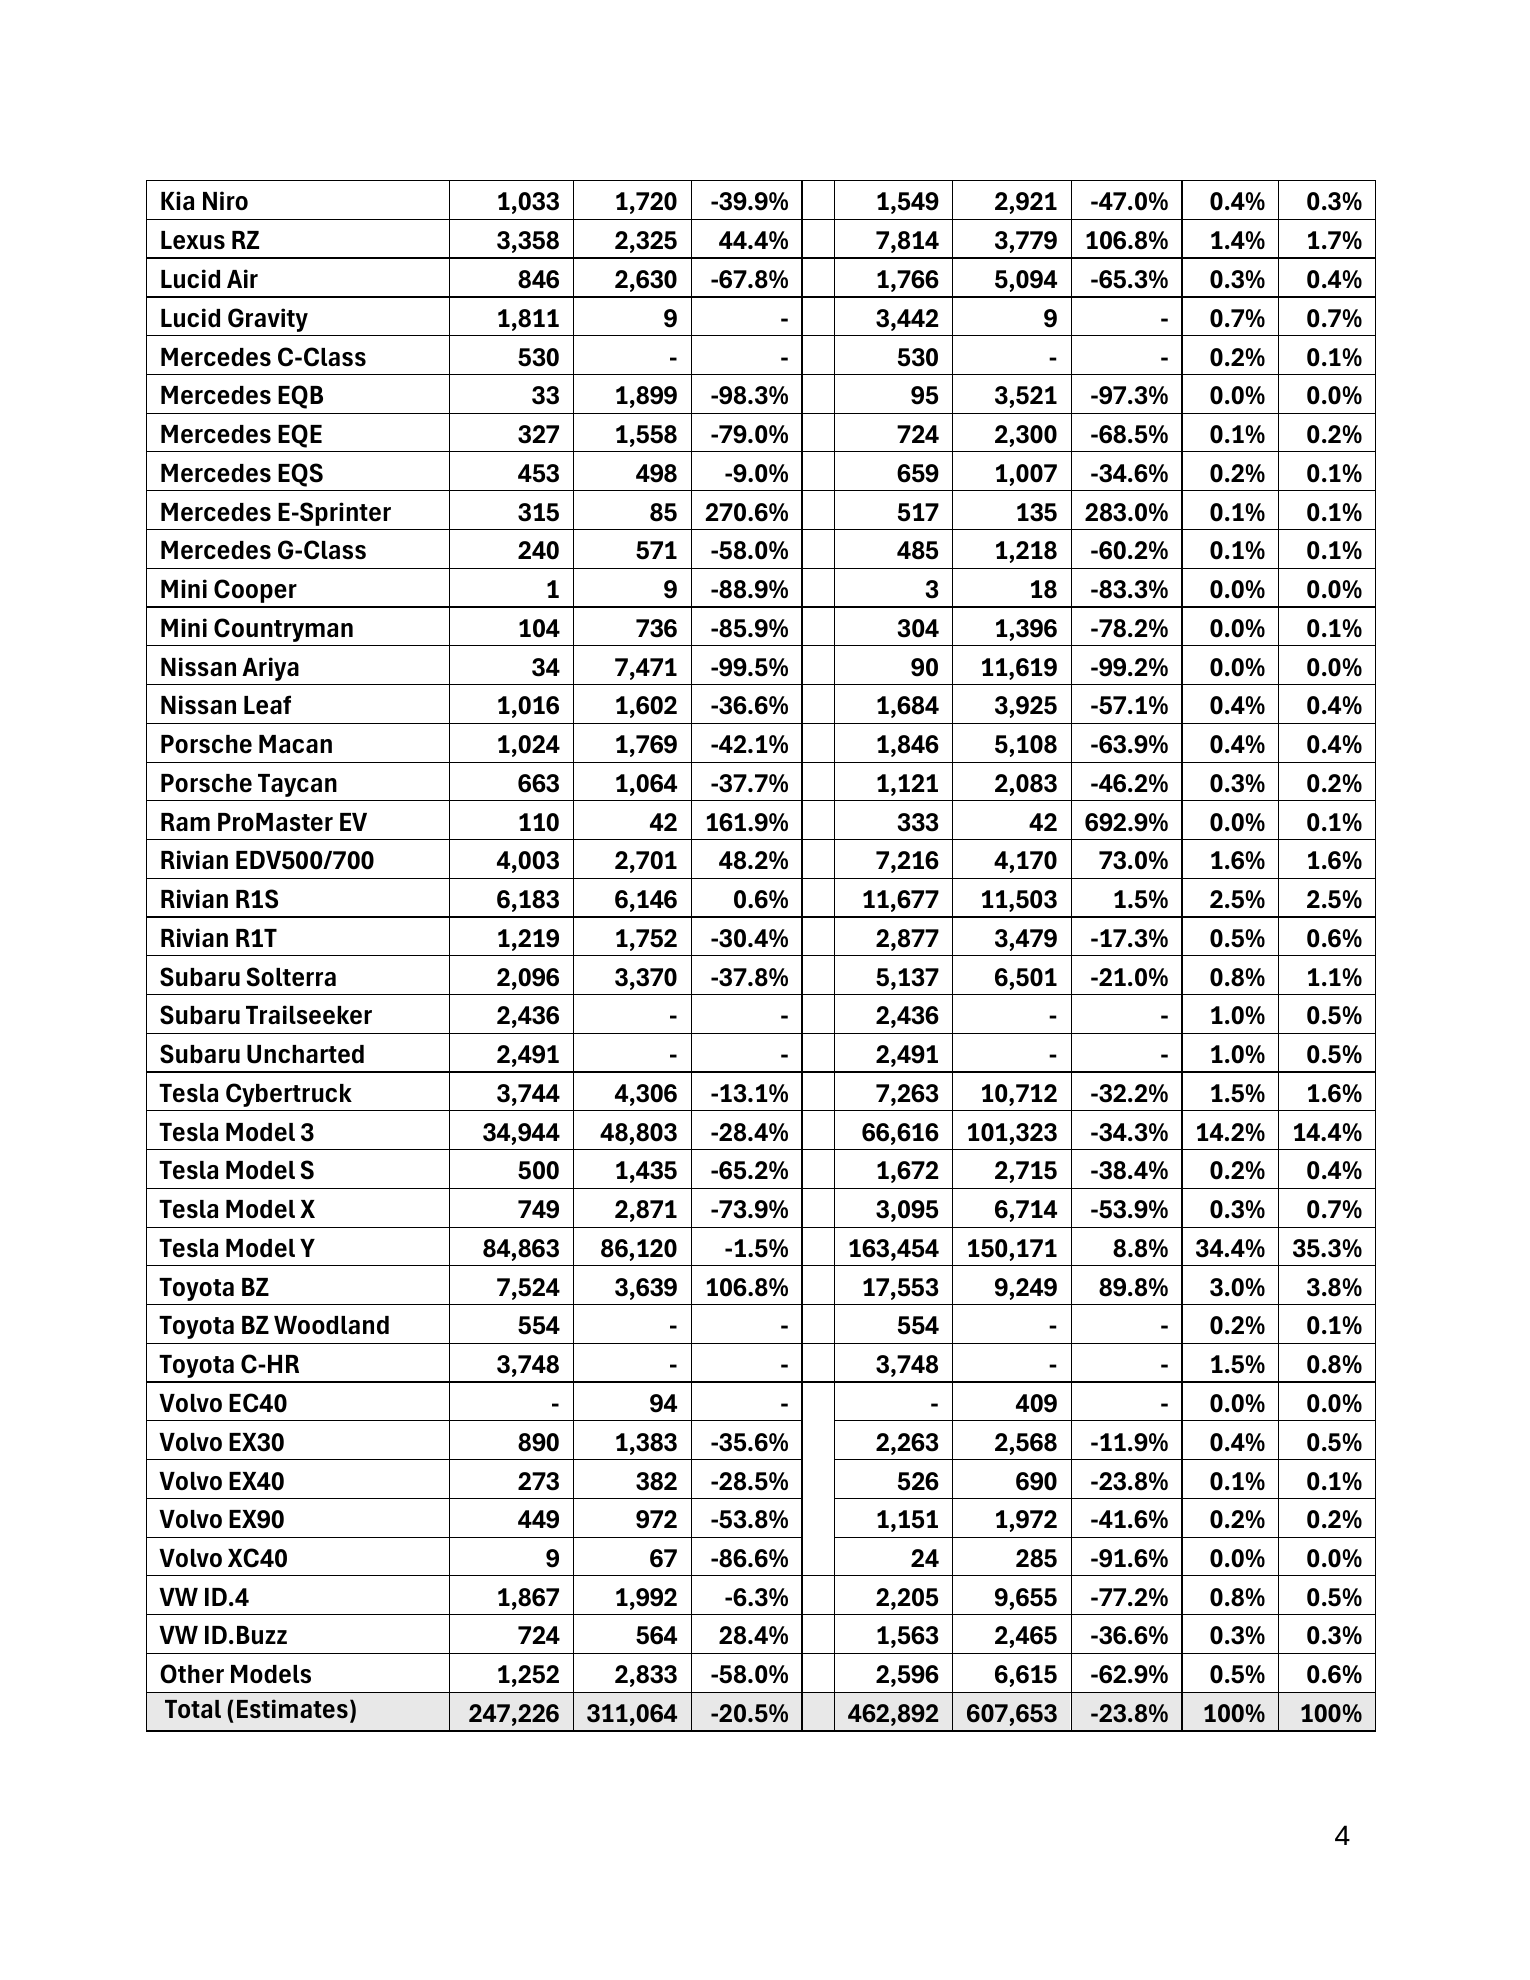
Figure 5. U.S. EV Model Sales Table from
this
report by Kelley Blue Book and Cox Automotive
Model Y sales were estimated at 84,863, down 1.5%, and Model 3 sales
were estimated at 34,944, down 28.4%. Cybertruck was estimated at
3,744, down 13.1%; Model X at 749, down 73.9%; and Model S at 500,
down 65.2%. Their shares of the U.S. EV segment were 1.5%, 0.3%, and
0.2%. Model Y and Model 3 supplied 96.0% of Tesla's estimated U.S.
sales, while Model Y alone supplied 68.0% of Tesla's U.S. volume and
34.4% of the full U.S. EV segment. These numbers are third-party
estimates, not Tesla-reported U.S. sales.
Tesla European Registration Performance
ACEA (European Automobile Manufacturers Association)

+54.6% Registrations YoY
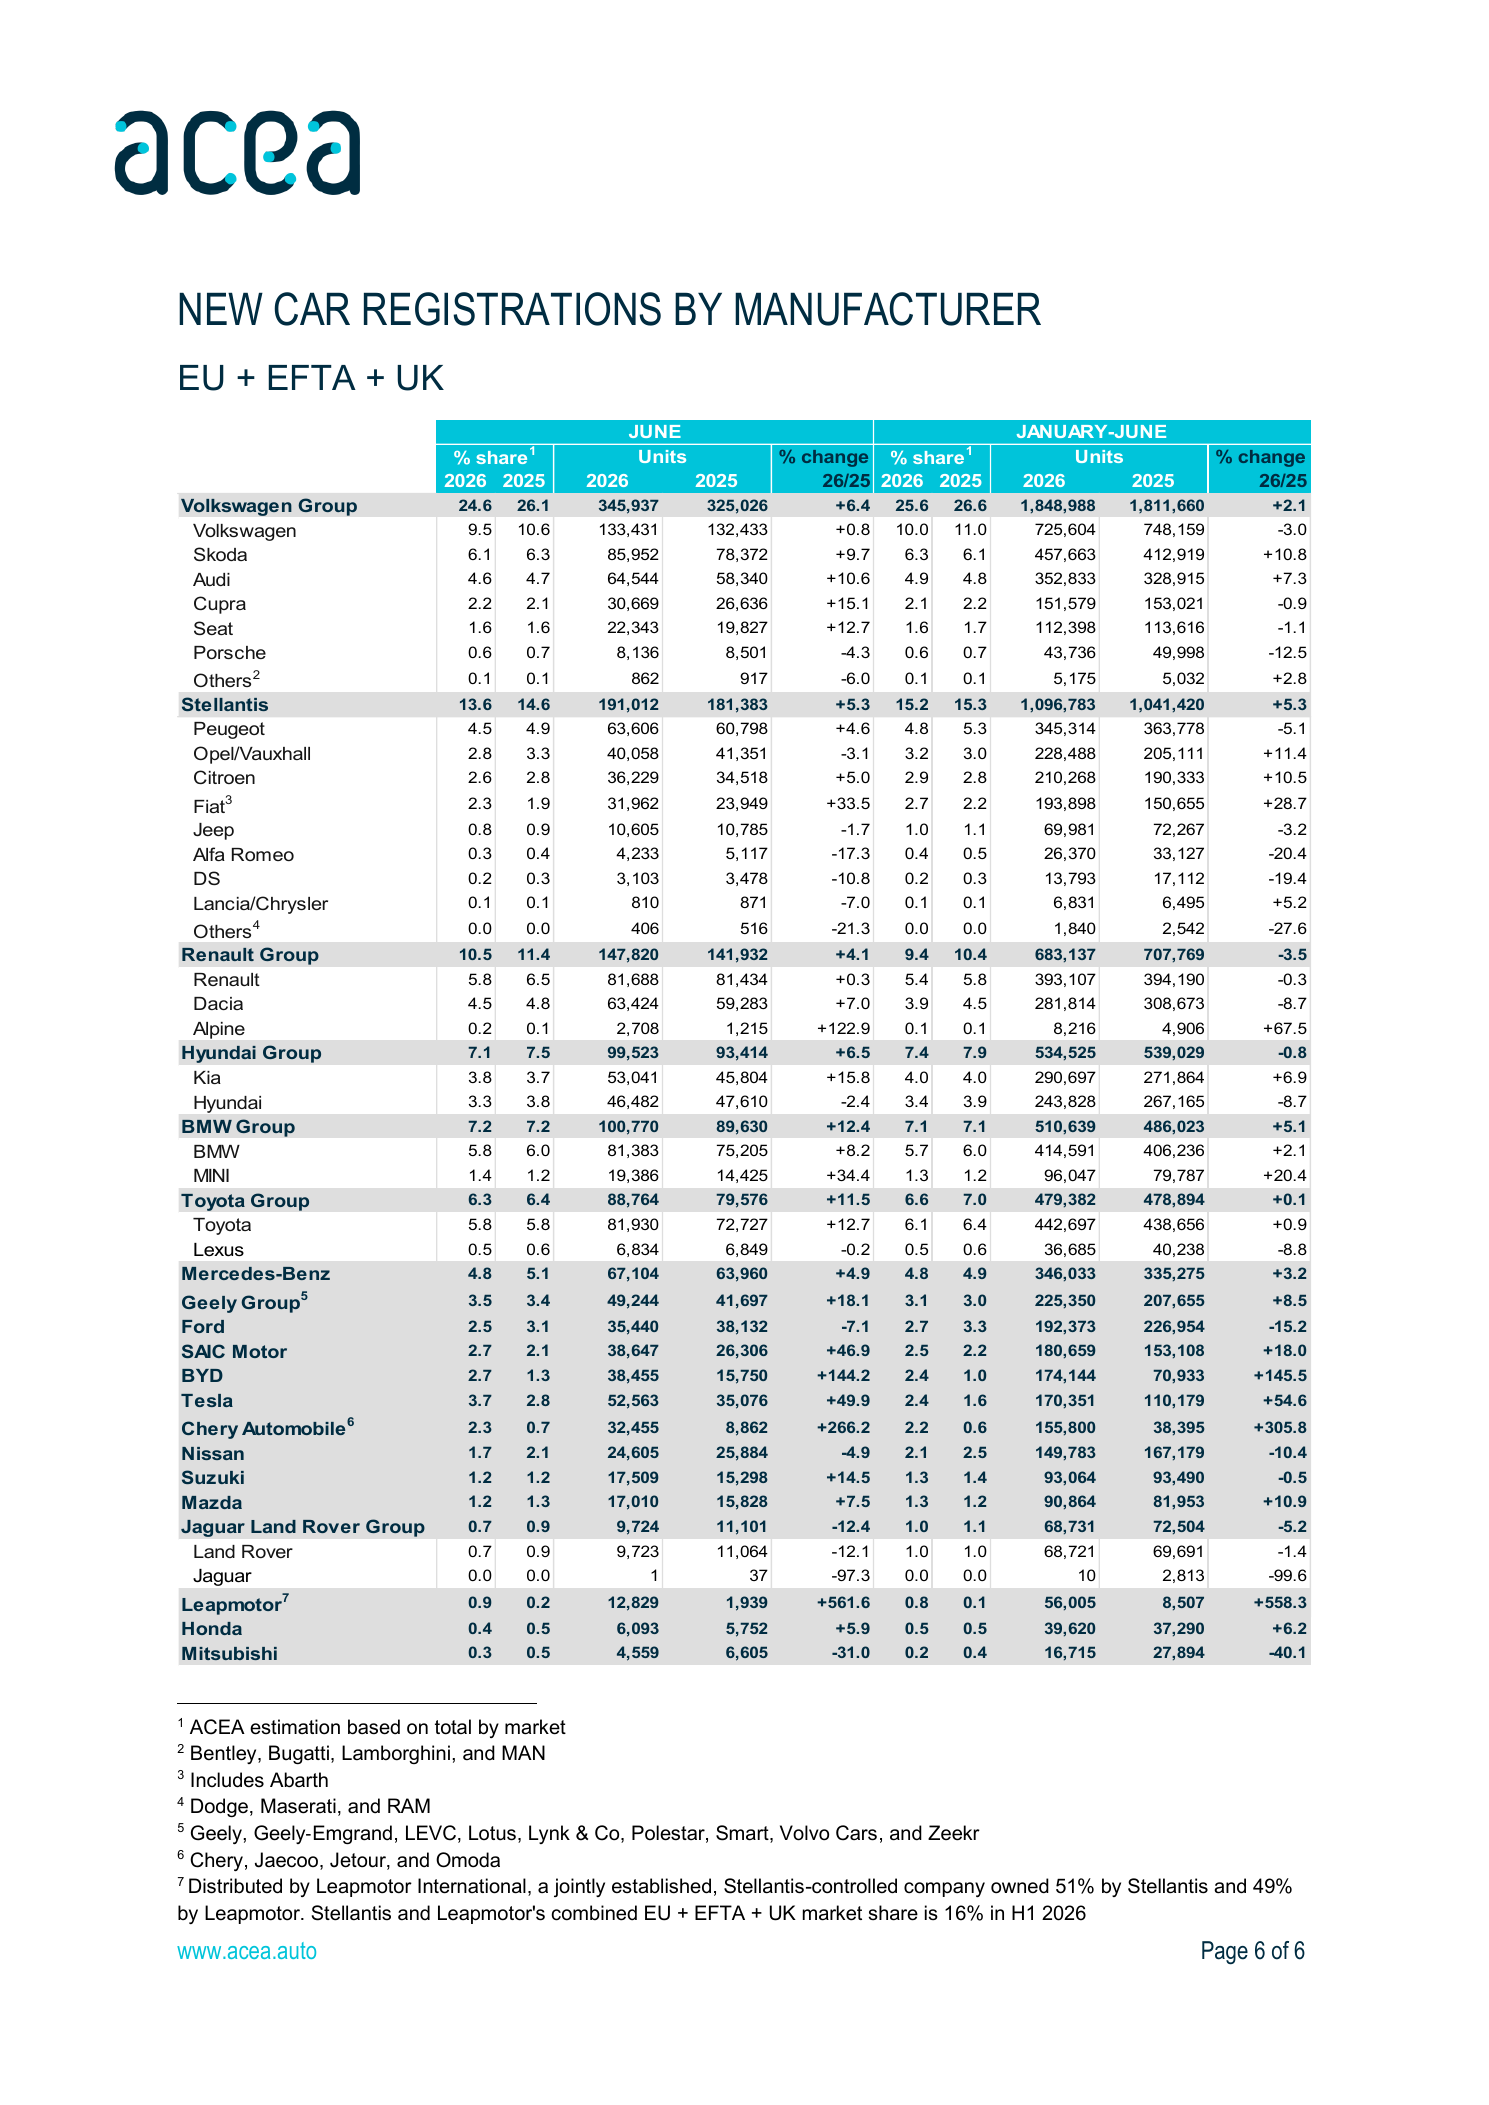
Figure 6. European Manufacturer Registration Table from
this
report by ACEA
Tesla recorded 170,351 registrations across the EU, EFTA, and UK in the
first half of 2026, compared with 110,179 in 2025, and June
registrations rose 49.9% to 52,563. Its share of all new-car
registrations rose from 1.6% to 2.4%. Tesla's 54.6% first-half growth
was faster than the region's 35.1% battery-electric growth, but BYD
recorded 174,144 registrations, 3,793 more than Tesla, and grew 145.5%.
In the EU alone, Tesla recorded 124,242 first-half registrations, up
75.4%, and 35,348 June registrations, up 72.1%. Its EU share was 2.1%
for the first half and 3.1% in June, while battery-electric vehicles
reached 20.7% of the first-half EU market, up from 15.6% one year
earlier. ACEA figures are provisional registrations, not Tesla-reported
deliveries.
Analysis
Was Tesla's Q2 2026 sales rebound broad-based, or was it concentrated in
certain products and regions?
-
Tesla's Q2 2026 sales rebound was primarily concentrated in the Model
Y and Model 3, with strong worldwide and European growth despite
declining estimated U.S. sales. Read Figure 1 for the current quarter
and Figure 2 for the five-quarter trend. Worldwide deliveries reached
480,126, up 25.0% year over year. Deliveries also rose 34.1% from Q1
2026. This confirms a large overall rebound.
-
Divide Model 3/Y deliveries by total deliveries: 467,762 / 480,126 =
97.4%. The Other Models bucket supplied only 12,364 deliveries, or
2.6%. Other Models improved year over year but fell 23.3% from Q1. The
rebound therefore remained overwhelmingly dependent on Model 3 and
Model Y.
-
Read the Tesla row in Figure 4 and the individual-model rows in Figure
5. Cox/KBB estimated 124,800 U.S. Tesla sales, down 13.1% year over
year. The Model Y was almost flat, while Model 3 fell 28.4%. The
worldwide increase did not mean Tesla grew in every region.
-
Read Tesla's row in Figure 6. H1 2026 registrations across the EU +
EFTA + UK increased 54.6% to 170,351. Since regional battery-electric
registrations grew 35.1%, Tesla outgrew the local BEV market. Europe
appears to be one major source of the worldwide rebound.
-
On the same ACEA table, compare Tesla with BYD. BYD reached 174,144
first-half registrations, 3,793 more than Tesla, and grew 145.5%.
Tesla recovered strongly, but a faster-growing rival still edged
ahead.
Evidence-based Conclusion
Tesla's Q2 2026 rebound was real at the worldwide level and was
supported by strong European growth. It was not broad-based across all
regions or models: estimated U.S. sales declined, and roughly 97% of
worldwide deliveries still came from Model 3/Y. The best interpretation
is
international recovery with continued product concentration and
intense competition, not a uniform global surge.
Other Questions Customers can Investigate
- Is Tesla growing worldwide, or only in certain regions?
- Which model produces most of Tesla's U.S. sales?
- Are Other Models becoming more important over time?
-
Is production running above or below deliveries, and what does that
suggest about inventory?
-
Is Tesla gaining share in a growing EV market or merely following
overall market growth?
- Which rivals are growing faster, and in which regions?
Action Items Suggested by the Findings
-
For Tesla/product planners: Reduce reliance on Model 3/Y by
improving or refreshing the rest of the lineup; investigate why Model
S and Model X U.S. estimates fell sharply.
-
For investors: Track regional growth and inventory alongside
worldwide deliveries; do not infer U.S. strength from global totals.
-
For shoppers: Use the KBB model table to identify which
vehicles have market momentum, then compare price, range, charging,
and ownership costs before buying.
-
For researchers: Update the three sources each quarter,
preserve the date and geography labels, and mark estimates separately
from official company figures.